En cliquant sur une imagette, vous accéderez au source et à l'image. En cliquant sur cette dernière, vous ouvrirez le fichier PDF associé.
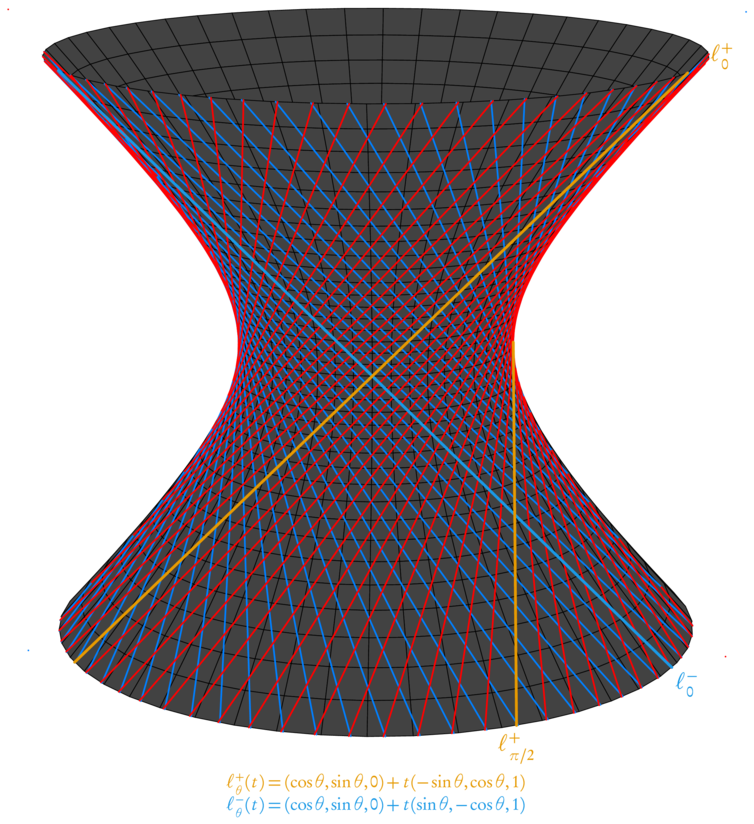
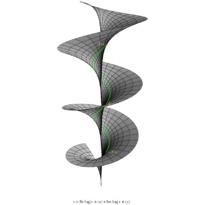
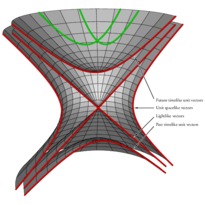
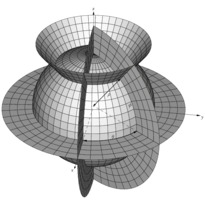
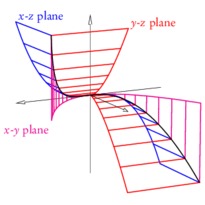
/* -*-ePiX-*- */
// A circular hyperboloid of one sheet and its two families of rulings
#include "epix.h"
using namespace ePiX;

// Uncomment for a shaded hyperboloid; makes the surface more visible,
// but the rulings harder to see
//#define SHADED

// Uncomment to draw three rulings in a slightly different color, for
// emphasis
#define RULINGS

const double MAX(3); // frame size
const double MAX2(1.5);  // parameter domain size
const double temp(sinh(MAX2));

// surface parametrization
P hyperboloid(double u, double v) { return cyl(cosh(u), v, sinh(u)); }

const int N1(36);  // latitudes
const int N2(48);  // longitudes

const int NUM_LINES(64); // # of rulings; should be a multiple of 4

const P LIGHT(1,1,0.5);  // location of light, for shading
const P VIEWPT(20, 0.5, 5);

const double EPS(0.0); //0.025; // shrinkage
const double du(2*MAX2/N1);
const double dv(1.0/N2);

// colors of rulings
void plus_color(void)
{
#ifdef RULINGS
  rgb(0.9,0.6,0);
#else
  red();
#endif
}
void minus_color(void)
{
#ifdef RULINGS
  rgb(0.1,0.6,0.9);
#else
  rgb(0,0.5,1);
#endif
}

// draw a ruling, truncating at the plane x=0
// (x,y,z) = (cos(th), sin(th), 0) + t*(-/+sin(t), +/-cos(t), 1)
void l_plus(double t)
{
  double t_min(-temp), t_max(temp);
  if (Cos(t) - t_max*Sin(t) < 0)
    t_max = Cot(t);

  if (Cos(t) - t_min*Sin(t) < 0)
    t_min = Cot(t);

  line(P(Cos(t) - t_max*Sin(t), Sin(t) + t_max*Cos(t), t_max),
       P(Cos(t) - t_min*Sin(t), Sin(t) + t_min*Cos(t), t_min));
}

void l_minus(double t)
{
  double t_min(-temp), t_max(temp);
  if (Cos(t) + t_max*Sin(t) < 0)
    t_max = -Cot(t);

  if (Cos(t) + t_min*Sin(t) < 0)
    t_min = -Cot(t);

  line(P(Cos(t)+t_max*Sin(t), Sin(t)-t_max*Cos(t), t_max),
       P(Cos(t)+t_min*Sin(t), Sin(t)-t_min*Cos(t), t_min));
}

// generalities
class element
{
private:
  P pt1, pt2, pt3, pt4;
  double distance;

public:
  element()
    : distance(camera.get_range()) { }

  element(P f(double u, double v), double u0, double v0)
    : pt1(f(u0+EPS,v0+EPS)), pt2(f(u0+du-EPS,v0+EPS)),
      pt3(f(u0+du-EPS,v0+dv-EPS)), pt4(f(u0+EPS,v0+dv-EPS))
  {
    P center(0.25*(pt1 + pt2 + pt3 + pt4));
    P temp(camera.get_viewpt());

    distance = norm(center-temp);
  }

  double how_far() const { return distance; }

  void draw() const
  {
    P normal((pt2 - pt1)*(pt4 - pt1));
    normal *= 1/norm(normal);


#ifdef SHADED
    double dens(0.75*(1-pow(normal|LIGHT, 2)/(LIGHT|LIGHT)));
    gray(dens);
#endif

    ePiX::quad(pt1, pt2, pt3, pt4);
  }
};

class By_distance {
public:
  bool operator() (const element& arg1, const element& arg2)
  {
    return arg1.how_far() > arg2.how_far();
  }
};


int main()
{
  bounding_box(P(-MAX,-MAX), P(MAX,MAX));
  unitlength("1in");
  picture(6,6);

  begin();
  revolutions();

  fill();
  crop();
  // use constant dark-gray shading if no shading requested
#ifndef SHADED
  gray(0.8);
#endif

  viewpoint(VIEWPT);
  std::vector<element> mesh(0);

  for (int i=0; i<N1; ++i)
    for (int j=0; j<N2; ++j)
      mesh.push_back(element(hyperboloid, -MAX2+du*i, dv*j));

  sort(mesh.begin(), mesh.end(), By_distance());

  for (unsigned int i=0; i<mesh.size(); ++i)
    mesh.at(i).draw();

  fill(false);

  bold();
  // hard-coded colors
  rgb(0,0.5,1);

  for (int i=-0.5*NUM_LINES; i <= 0.5*NUM_LINES; ++i)
    l_minus(i*1.0/NUM_LINES);

  red();
  for (int i=-0.5*NUM_LINES; i <= 0.5*NUM_LINES; ++i)
    l_plus(i*1.0/NUM_LINES);

#ifndef RULINGS
  pen(2);
#else
  pen(1.5);
#endif
  minus_color();
  line(P(1,0,0)-P(0,-temp,temp),P(1,0,0)+P(0,-temp,temp));
  label(P(1,0,0)-P(0,-temp,temp), P(2,-2), "$\\ell_0^-$", br);

  font_size("footnotesize");
  label(P(0,0,-1.5*temp), P(0,-24),
	"$\\ell_\\theta^-(t)=(\\cos\\theta, \\sin\\theta, 0) + t(\\sin\\theta, -\\cos\\theta, 1)$", b);

  font_size();
  plus_color();
  line(P(1,0,0)-P(0, temp,temp),P(1,0,0)+P(0, temp,temp));
  label(P(1,0,0)+P(0, temp,temp), P(18,2), "$\\ell_0^+$", t);

  line(P(0,1,0)-P(-temp,0,temp), P(0,1,0));
  label(P(0,1,0)-P(-temp,0,temp), P(0,-4), "$\\ell_{\\pi/2}^+$",b);

  font_size("footnotesize");
  label(P(0,0,-1.5*temp), P(0,-12),
	"$\\ell_\\theta^+(t)=(\\cos\\theta, \\sin\\theta, 0) + t(-\\sin\\theta, \\cos\\theta, 1)$", b);

  end();
}